
So you followed my advice and opened a Roth IRA at Vanguard. You invested some money into it and think you are done. WRONG! This is a common mistake that I’ve seen many teachers make. They invest money into their retirement accounts, do nothing, and expect it to grow. It might grow, but it’s not going to grow by much when it’s only invested in a simple money market account, which is what happens to your money when you don’t designate it into purchasing a specific stock or fund. In this post, we are going to show you how to analyze the important information from an equity quote.
Let’s start out with a simple stock. We will look at a popular stock from a strong company, Apple (AAPL). Apple has been a strong company for over a decade with their strong sales in technology.
Detailed quote information
| Open | 196.31 |
|---|---|
| High | 198.07 |
| Low | 194.04 |
| Prev close | 193.34 |
| 52 Wk high | 233.47 |
| 52 Wk low | 142.00 |
| Average volume | 24.62 M |
| Bid (Size) | 196.80 (2,000) |
|---|---|
| Ask (Size) | 197.00 (2,100) |
| Outstanding shares | 4.60 B |
| Market cap | 873.74 B |
| EPS | 11.78 |
| P/E ratio | 16.41 |
| Div yield | 1.59 |
So, we see Apple’s current quote above. Let’s look at each line.
OPEN – This is the price that the stock started the day at.
HIGH – This is the highest price of the stock on the day.
LOW – This is the lowest price of the stock on the day.
PREV CLOSE – This is where the stock closed on the previous day.
52 WEEK HIGH – The highest price of the stock in the last year.
52 WEEK LOW – The lowest price of the stock in the last year.
AVERAGE VOLUME – This is how many of the stocks are bought and sold in a given day.
BID (SIZE) – This is the price that someone is willing to pay for the stock and how many shares they want to buy.
ASK (SIZE) – This is the price that someone is willing to sell the stock at and how many shares are available.
OUTSTANDING SHARES – This is how many shares are available in the company.
MARKET CAP – This is how much the company is worth based on the number of shares outstanding and the price per share.
EPS (Earnings per share) – This is how much money the company makes for each outstanding share. This number can be negative as well. Some companies, especially new, rapidly growing companies, invest their money back into the company and show no profit.
P/E Ratio (Price to Earnings Ratio) – This is the price per share divided by the earnings per share. The higher this number is, the more investors believe that the company will grow. It could also mean that the stock is overpriced.
Dividend Yield – This is the percent that you will earn from each share. So from Apple, you would earn 1.59% on your money each year. This dividend is paid out from the company from its profits. Sometimes a company will increase their dividend, but other times, they may decrease it. Some companies pay out no dividend at all. They choose to reinvest their profits to grow their company. Amazon is a company like this.
Next, let’s look at a “fund”, which is a collection of stocks.
Last price as of 08/06/2019 | $147.03 | $1.89 1.30% |
52-week high | $154.37 | |
52-week low | $119.54 | $34.83 29.14% (52-week difference) |
NAV | $145.08 | -$4.45 -2.98% |
| 1.83% B |
Open | $146.19 |
Previous close | $145.14 |
Day range | $145.21 – $147.08 |
Bid | $146.34 |
Ask | $147.03 |
You can see that most of the information for a fund is the same. Why would someone buy a collection of stocks? Instead of taking a gamble on one company, you are betting on all of those companies doing well. If you invest in a single company, that company could go broke, and you could lose all of your money. Now, odds are that a company like Apple will definitely not be going broke, but some people like to spread their risk. “Funds” can come as a mutual fund or an ETF (exchange traded fund). These funds are very similar except that an ETF usually only requires that you buy one share at a time, and a mutual fund requires a minimum dollar investment.
There is another big different between them. When you purchase a stock, you will have to pay a commission to buy that stock. Usually it’s a flat fee no matter how many shares you purchase at a time. When you purchase a fund, for example VTI from Vanguard, VTI is a Vanguard fund, so you will pay no fees!
How does Vanguard make their money? They have something called an expense ratio. The expense ratio is one of the most important things to look at when deciding on which fund to buy. The lower the expense ratio, the more money you keep instead of paying to the brokerage. Do NOT buy into the idea that a “managed” fund is any better than an index.
The expense ratio for VTI is 0.03%. This is very good. Now VTI is an ETF. This means you must purchase full shares. The “con” of this is that you may have money sitting in a money market while you wait for enough to purchase a full share. VTSAX is the “big brother” of VTI. It holds the same stocks, but with VTSAX, you can buy partial shares which means every one of your dollars is invested and at work!

Last thing. Pay attention to those fees. They can sneak up on you. The reason I like Vanguard so much is the fees stay low on their funds. It’s also where you need to be careful about what a financial adviser might try to sell you for funds. Some of them can have up to 1% fees. That’s 30x the amount you’d pay for index funds you can manage yourself.
Hopefully this post shed some light on how to analyze a stock or fund and eliminates some of the confusion as to what all those symbols mean.
Keep Stackin!
Minnesota TRA Full Retirement Age: What Age 65 Really Means
Most Minnesota teachers hear terms like Rule of 90 or 60/30 long
Minnesota TRA Early Retirement Reduction Explained
Teaching in Minnesota has become more demanding in recent years. Expectations are
Minnesota TRA Tier I vs Tier II Explained
Minnesota Rule of 90: Complete Guide for TRA Tier I Teachers
Minnesota’s Rule of 90 is one of the most consequential retirement provisions
Minnesota TRA Pension Calculator (High-5 Formula Explained + Examples)
Most Minnesota teachers know they will receive a TRA pension through the
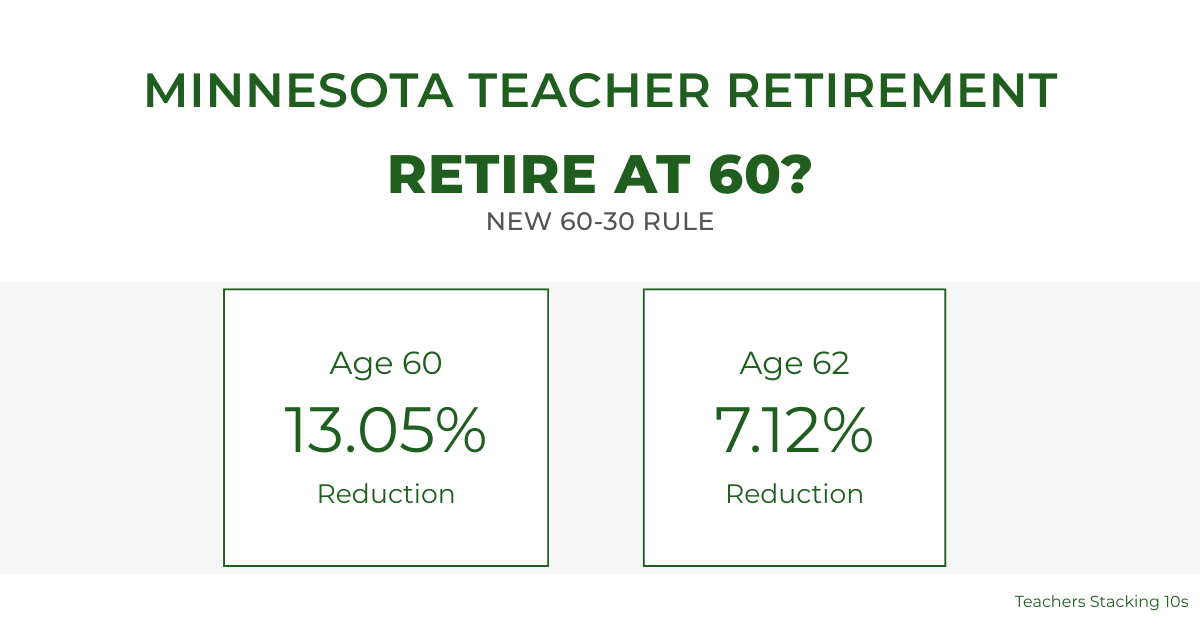
Minnesota Teacher Retirement at 60: Understanding the Enhanced 60/30 Rule
For years, Minnesota teacher retirement at age 60 was financially unrealistic for
Leave a Reply
You must be logged in to post a comment.